- use retrieve_data.py to get data for 600519
import tushare as ts
import time

st=ts.get_stock_basics()
print(st.head())
print((st.loc['600016']))
list1=['600016', '600519']

index=False
autype='hfq'
ktype='D'
ds='2018-01-01'
de=time.strftime('%Y-%m-%d', time.localtime(time.time()))
print(de)
i=0
for ss in list1:
    i=i+1
    print(i,ss)
    for autype in ['qfa', 'None', 'hfq']:
        for ktype in ['D', 'W', 'M']:
            pp=''
            if autype=='None':
                pp=pp+'none\\'
            if autype=='hfq':
                pp=pp+'hfq\\'
            if index==True:
                pp=pp+'index'

            kk=''
            if ktype=='D':
                kk=kk+'day\\'
            if ktype=='W':
                kk=kk+'week\\'
            if ktype=='M':
                kk=kk+'month\\'
            if ktype=='5':
                kk=kk+'minutes\\5\\'

            df1 = ts.get_k_data(ss,ktype=ktype,start=ds,index=index,autype=autype)
            ss1=kk+pp+ss+'.csv'
            print(ss1)
            df1.to_csv(ss1, encoding='gbk')
import tushare as ts
import time
st=ts.get_stock_basics()
print(st.head())
print((st.loc['600016']))
list1=['600016', '600519']
index=False
autype='hfq'
ktype='D'
ds='2018-01-01'
de=time.strftime('%Y-%m-%d', time.localtime(time.time()))
print(de)
i=0
for ss in list1:
i=i+1
print(i,ss)
for autype in ['qfa', 'None', 'hfq']:
for ktype in ['D', 'W', 'M']:
pp=''
if autype=='None':
pp=pp+'none\\'
if autype=='hfq':
pp=pp+'hfq\\'
if index==True:
pp=pp+'index'
kk=''
if ktype=='D':
kk=kk+'day\\'
if ktype=='W':
kk=kk+'week\\'
if ktype=='M':
kk=kk+'month\\'
if ktype=='5':
kk=kk+'minutes\\5\\'
df1 = ts.get_k_data(ss,ktype=ktype,start=ds,index=index,autype=autype)
ss1=kk+pp+ss+'.csv'
print(ss1)
df1.to_csv(ss1, encoding='gbk')
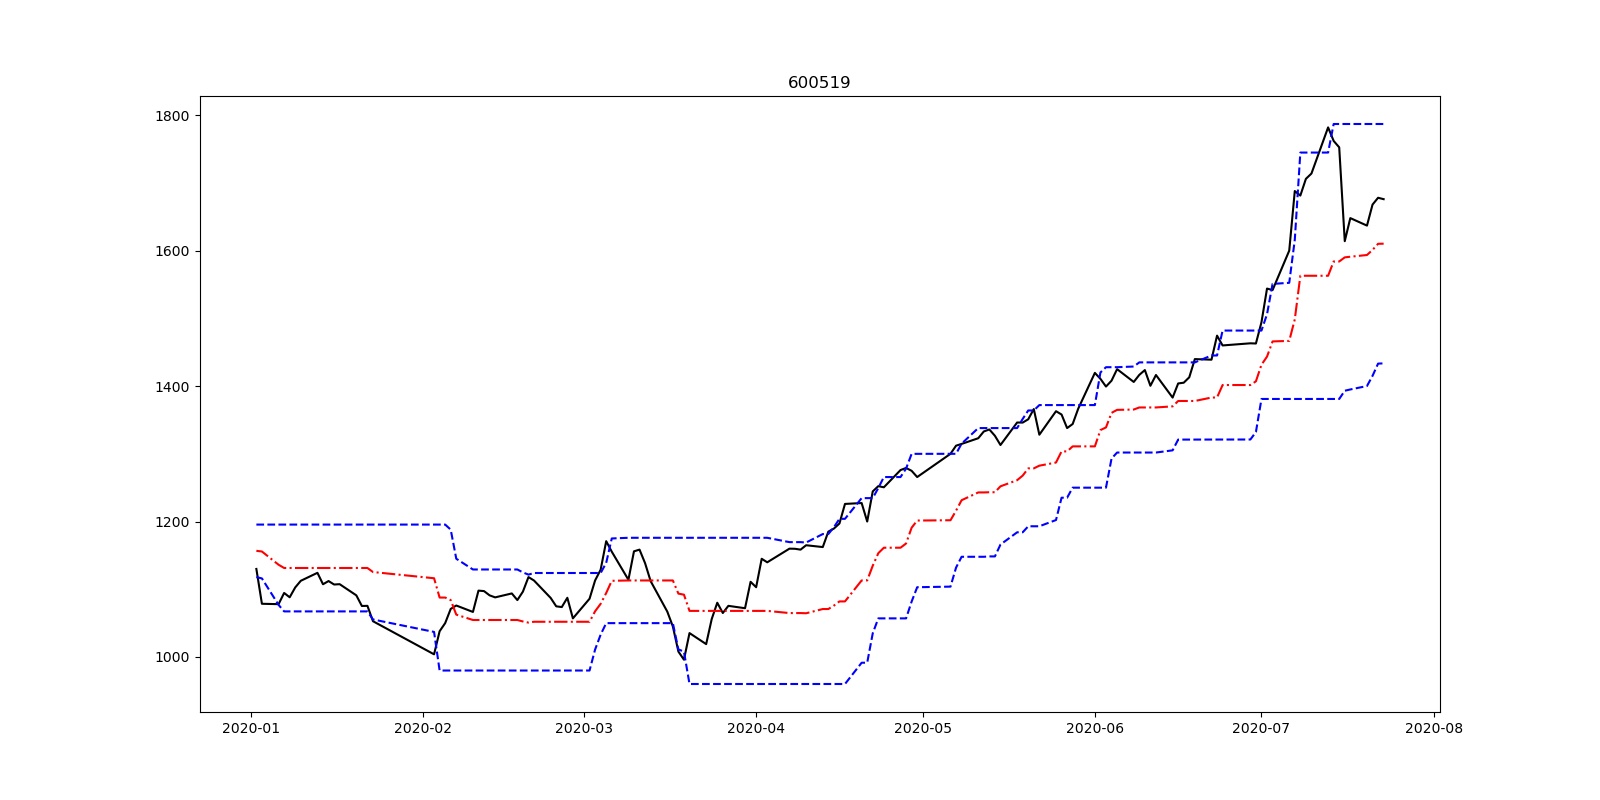
2. generate Donchian Channels Chart from the csv file
import pandas as pd
import numpy as np
import matplotlib.pyplot as plt
ChinaUnicom=pd.read_csv('600519.csv')
ChinaUnicom.index=ChinaUnicom.iloc[:,1]
ChinaUnicom.index=pd.to_datetime(ChinaUnicom.index, format='%Y-%m-%d')
ChinaUnicom=ChinaUnicom.iloc[:,2:]
Close=ChinaUnicom.close
High=ChinaUnicom.high
Low=ChinaUnicom.low
upboundDC=pd.Series(0.0,index=Close.index)
downboundDC=pd.Series(0.0,index=Close.index)
midboundDC=pd.Series(0.0,index=Close.index)
for i in range(20,len(Close)):
    upboundDC[i]=max(High[(i-20):i])
    downboundDC[i]=min(Low[(i-20):i])
    midboundDC[i]=0.5*(upboundDC[i]+downboundDC[i])
upboundDC=upboundDC[20:]
downboundDC=downboundDC[20:]
midboundDC= midboundDC[20:]
fig = plt.figure(figsize=(16, 8))
#plt.rcParams['font.sans-serif'] = ['SimHei']
plt.plot(Close['2020'],label="Close",color='k')
plt.plot(upboundDC['2020'],label="upboundDC",color='b',linestyle='dashed')
plt.plot(midboundDC['2020'],label="midboundDC",color='r',linestyle='-.')
plt.plot(downboundDC['2020'],label="downboundDC",color='b',linestyle='dashed')
plt.title("600519 Donchian channel 2020")
#plt.ylim(2.9,3.9)
plt.show()
import pandas as pd
import numpy as np
import matplotlib.pyplot as plt
ChinaUnicom=pd.read_csv('600519.csv')
ChinaUnicom.index=ChinaUnicom.iloc[:,1]
ChinaUnicom.index=pd.to_datetime(ChinaUnicom.index, format='%Y-%m-%d')
ChinaUnicom=ChinaUnicom.iloc[:,2:]
Close=ChinaUnicom.close
High=ChinaUnicom.high
Low=ChinaUnicom.low
upboundDC=pd.Series(0.0,index=Close.index)
downboundDC=pd.Series(0.0,index=Close.index)
midboundDC=pd.Series(0.0,index=Close.index)
for i in range(20,len(Close)):
upboundDC[i]=max(High[(i-20):i])
downboundDC[i]=min(Low[(i-20):i])
midboundDC[i]=0.5*(upboundDC[i]+downboundDC[i])
upboundDC=upboundDC[20:]
downboundDC=downboundDC[20:]
midboundDC= midboundDC[20:]
fig = plt.figure(figsize=(16, 8))
#plt.rcParams['font.sans-serif'] = ['SimHei']
plt.plot(Close['2020'],label="Close",color='k')
plt.plot(upboundDC['2020'],label="upboundDC",color='b',linestyle='dashed')
plt.plot(midboundDC['2020'],label="midboundDC",color='r',linestyle='-.')
plt.plot(downboundDC['2020'],label="downboundDC",color='b',linestyle='dashed')
plt.title("600519 Donchian channel 2020")
#plt.ylim(2.9,3.9)
plt.show()