
Stop spending time manually tweaking misaligned arrows in visio, now you can create beautiful architecture diagrams with Python diagrams library!
- installation on Ubuntu
sudo apt-get install python3-pydot graphviz
sudo pip3 install diagrams
2. get sample code diagram.py from https://diagrams.mingrammer.com/docs/getting-started/examples
from diagrams import Cluster, Diagram
from diagrams.onprem.analytics import Spark
from diagrams.onprem.compute import Server
from diagrams.onprem.database import PostgreSQL
from diagrams.onprem.inmemory import Redis
from diagrams.onprem.aggregator import Fluentd
from diagrams.onprem.monitoring import Grafana, Prometheus
from diagrams.onprem.network import Nginx
from diagrams.onprem.queue import Kafka
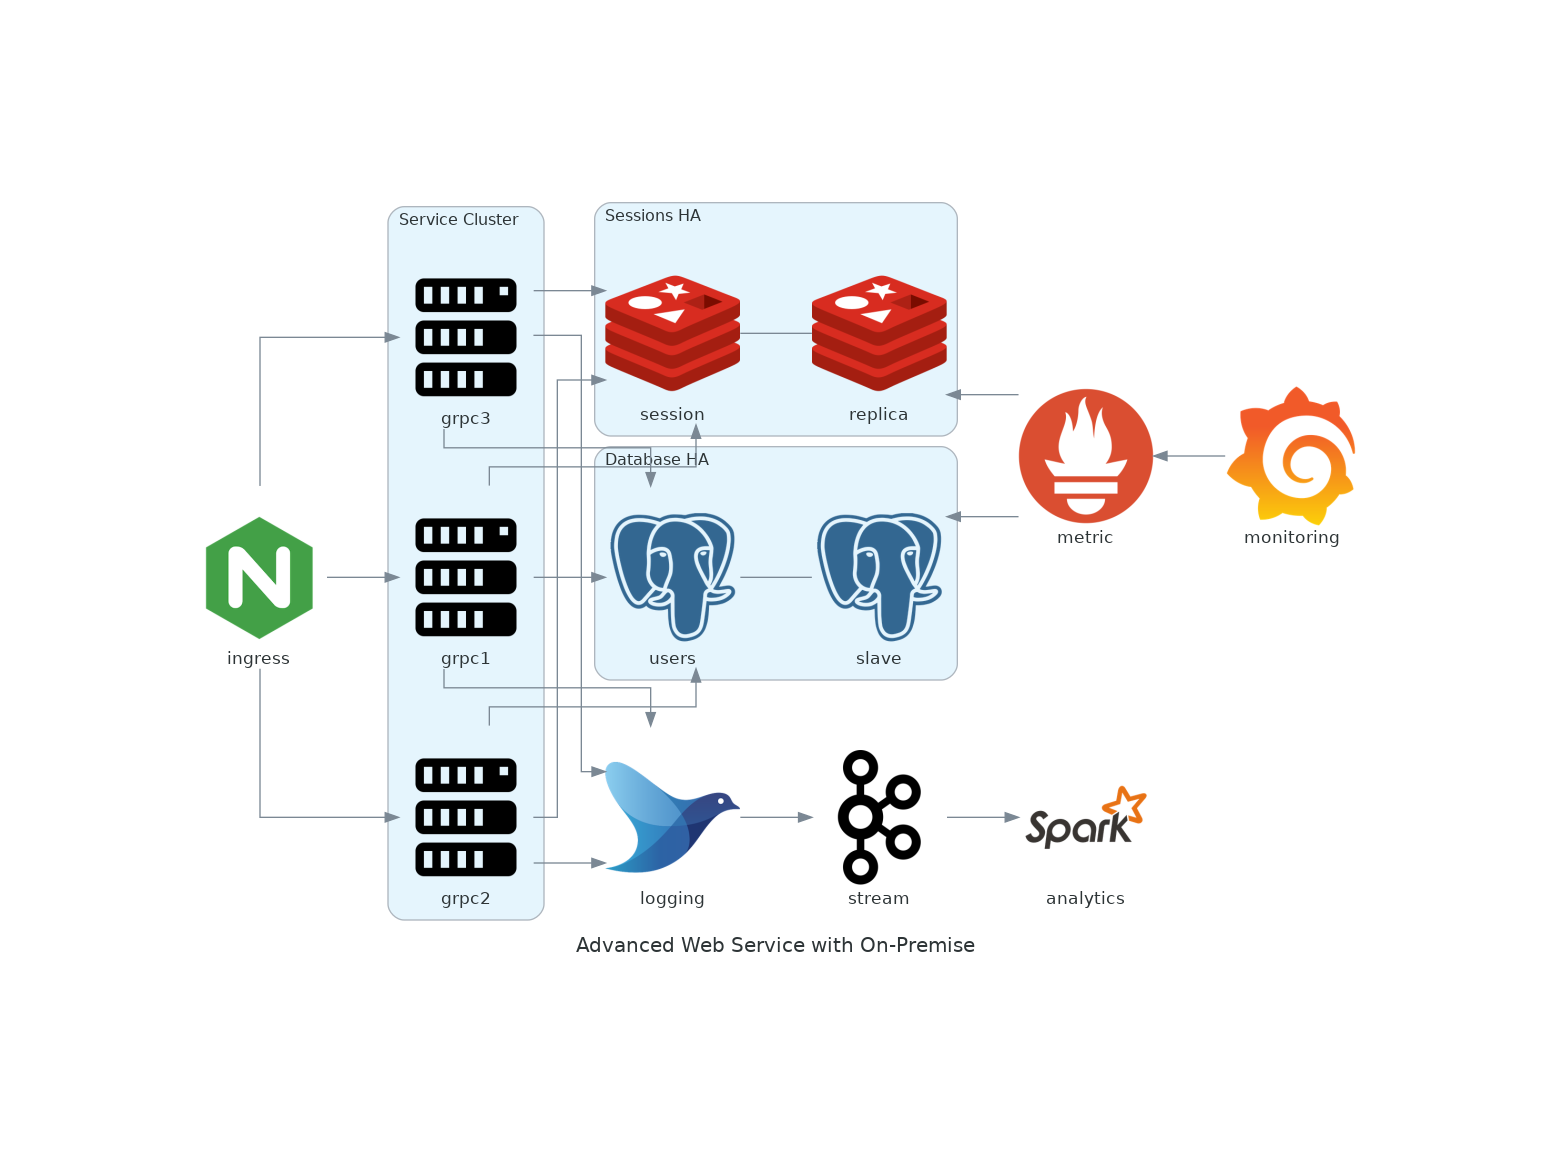
with Diagram("Advanced Web Service with On-Premise", show=False):
ingress = Nginx("ingress")
metrics = Prometheus("metric")
metrics << Grafana("monitoring")
with Cluster("Service Cluster"):
grpcsvc = [
Server("grpc1"),
Server("grpc2"),
Server("grpc3")]
with Cluster("Sessions HA"):
master = Redis("session")
master - Redis("replica") << metrics
grpcsvc >> master
with Cluster("Database HA"):
master = PostgreSQL("users")
master - PostgreSQL("slave") << metrics
grpcsvc >> master
aggregator = Fluentd("logging")
aggregator >> Kafka("stream") >> Spark("analytics")
ingress >> grpcsvc >> aggregator
3. run it with python3 diagram.py, you will get advanced_web_service_with_on-premise.png in same folder
Wonderful beat ! I would like to apprentice while you amend your site,
how could i subscribe for a blog website? The account helped me
a acceptable deal. I were tiny bit acquainted of this your broadcast offered vibrant transparent concept
Also visit my homepage – Keto Fat Burn Review
Hi there it’s me, I am also visiting this web site
on a regular basis, this web site is in fact good
and the users are truly sharing pleasant thoughts.
Feel free to visit my web page – D-Fine8 Reviews