
Step 1: Install required Python libraries
pip install descartes
pip install geopandas
pip install matplotlib
pip install numpy
pip install pandas
pip install descartes
pip install geopandas
pip install matplotlib
pip install numpy
pip install pandas
pip install descartes pip install geopandas pip install matplotlib pip install numpy pip install pandas
Step 2: Download Canada population and shapefile
you can search and Download Canada shapefile from Statistics Canada or pull it from Github(https://github.com/zhuby1973/geopandas.git)
the shapefile include 3 files, we need save it in same folder:
lpr_000b16a_e.dbf
lpr_000b16a_e.shp
lpr_000b16a_e.shx
Step 3: Begin to code
import pandas as pd
import numpy as np
import geopandas as gpd
import matplotlib.pyplot as plt
#load Canada shapefile
fp = "lpr_000b16a_e.shp"
map_df = gpd.read_file(fp)
#load Canada population csv file
province = pd.read_csv("1710000901-eng.csv", sep=",")
# join the geodataframe with the csv dataframe
merged = map_df.merge(province, how='left', left_on="PRENAME", right_on="Geography")
merged=merged.rename(index=str, columns={"PRENAME":"PRENAME", "geometry":"geometry", "Q4 2020":"population"})
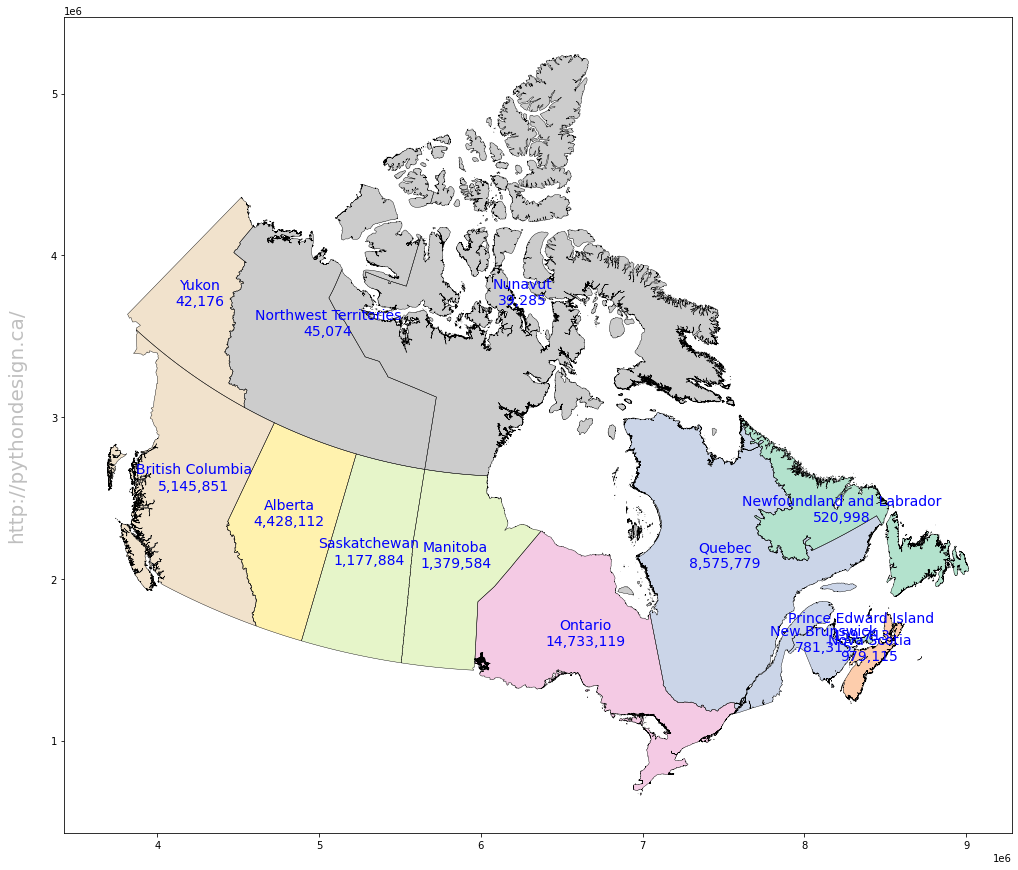
# add province name and populations on map
fig = plt.figure(1, figsize=(25,15))
ax = fig.add_subplot()
merged.apply(lambda x: ax.annotate(text=x.PRENAME + "\n" + str(x.population), xy=x.geometry.centroid.coords[0], ha='center', fontsize=14, color='blue'), axis=1);
merged.boundary.plot(ax=ax, color='Black', linewidth=.4)
merged.plot(ax=ax, cmap='Pastel2', figsize=(12, 12))
ax.text(-0.05, 0.5, 'http://pythondesign.ca/', transform=ax.transAxes,
fontsize=20, color='gray', alpha=0.5,
ha='center', va='center', rotation='90')
import pandas as pd
import numpy as np
import geopandas as gpd
import matplotlib.pyplot as plt
#load Canada shapefile
fp = "lpr_000b16a_e.shp"
map_df = gpd.read_file(fp)
#load Canada population csv file
province = pd.read_csv("1710000901-eng.csv", sep=",")
# join the geodataframe with the csv dataframe
merged = map_df.merge(province, how='left', left_on="PRENAME", right_on="Geography")
merged=merged.rename(index=str, columns={"PRENAME":"PRENAME", "geometry":"geometry", "Q4 2020":"population"})
# add province name and populations on map
fig = plt.figure(1, figsize=(25,15))
ax = fig.add_subplot()
merged.apply(lambda x: ax.annotate(text=x.PRENAME + "\n" + str(x.population), xy=x.geometry.centroid.coords[0], ha='center', fontsize=14, color='blue'), axis=1);
merged.boundary.plot(ax=ax, color='Black', linewidth=.4)
merged.plot(ax=ax, cmap='Pastel2', figsize=(12, 12))
ax.text(-0.05, 0.5, 'http://pythondesign.ca/', transform=ax.transAxes,
fontsize=20, color='gray', alpha=0.5,
ha='center', va='center', rotation='90')
Step 4: Execute the code to generate the map
Inspired by:
1. https://health-infobase.canada.ca/covid-19/dashboard/
2. https://jcutrer.com/python/learn-geopandas-plotting-usmaps
need fix the overlapping annotations later.