- install python library
pip3 install pyecharts
pip3 install xlrd - download excel data ca.xls from https://github.com/zhuby1973/geopandas
- write the code
import pandas as pd
from pyecharts.charts import Pie
from pyecharts import options as opts
# load data
df = pd.read_excel("ca.xls")
v = df['Province'].values.tolist()
d = df['cases'].values.tolist()
# set color
color_series = ['#FAE927','#E9E416','#C9DA36','#9ECB3C','#6DBC49',
'#37B44E','#3DBA78','#14ADCF','#209AC9','#1E91CA',
'#2C6BA0','#2B55A1','#2D3D8E','#44388E','#6A368B'
'#7D3990','#A63F98','#C31C88','#D52178','#D5225B',
'#D02C2A','#D44C2D','#F57A34','#FA8F2F','#D99D21',
'#CF7B25','#CF7B25','#CF7B25']
pie1 = Pie(init_opts=opts.InitOpts(width='1350px', height='750px'))
pie1.set_colors(color_series)
pie1.add("", [list(z) for z in zip(v, d)],
radius=["30%", "135%"],
center=["50%", "65%"],
rosetype="area"
)
pie1.set_global_opts(title_opts=opts.TitleOpts(title='rose'),
legend_opts=opts.LegendOpts(is_show=False),
toolbox_opts=opts.ToolboxOpts())
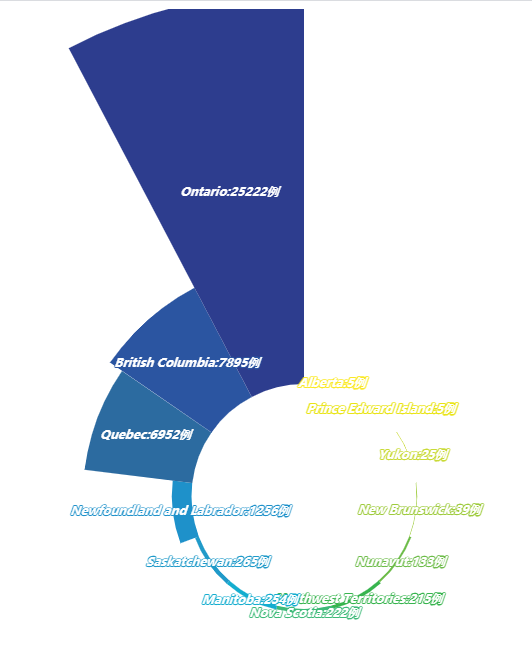
pie1.set_series_opts(label_opts=opts.LabelOpts(is_show=True, position="inside", font_size=12,
formatter="{b}:{c}例", font_style="italic",
font_weight="bold", font_family="Microsoft YaHei"
),
)
# generate html file
pie1.render("rose.html")