
Step 1: Install required Python libraries
pip install descartes
pip install geopandas
pip install matplotlib
pip install numpy
pip install pandas
Step 2: Download Canada population and shapefile
you can search and Download Canada shapefile from Statistics Canada or pull it from Github(https://github.com/zhuby1973/geopandas.git)
the shapefile include 3 files, we need save it in same folder:
lpr_000b16a_e.dbf
lpr_000b16a_e.shp
lpr_000b16a_e.shx
Step 3: Begin to code
import pandas as pd
import numpy as np
import geopandas as gpd
import matplotlib.pyplot as plt
#load Canada shapefile
fp = "lpr_000b16a_e.shp"
map_df = gpd.read_file(fp)
#load Canada population csv file
province = pd.read_csv("1710000901-eng.csv", sep=",")
# join the geodataframe with the csv dataframe
merged = map_df.merge(province, how='left', left_on="PRENAME", right_on="Geography")
merged=merged.rename(index=str, columns={"PRENAME":"PRENAME", "geometry":"geometry", "Q4 2020":"population"})
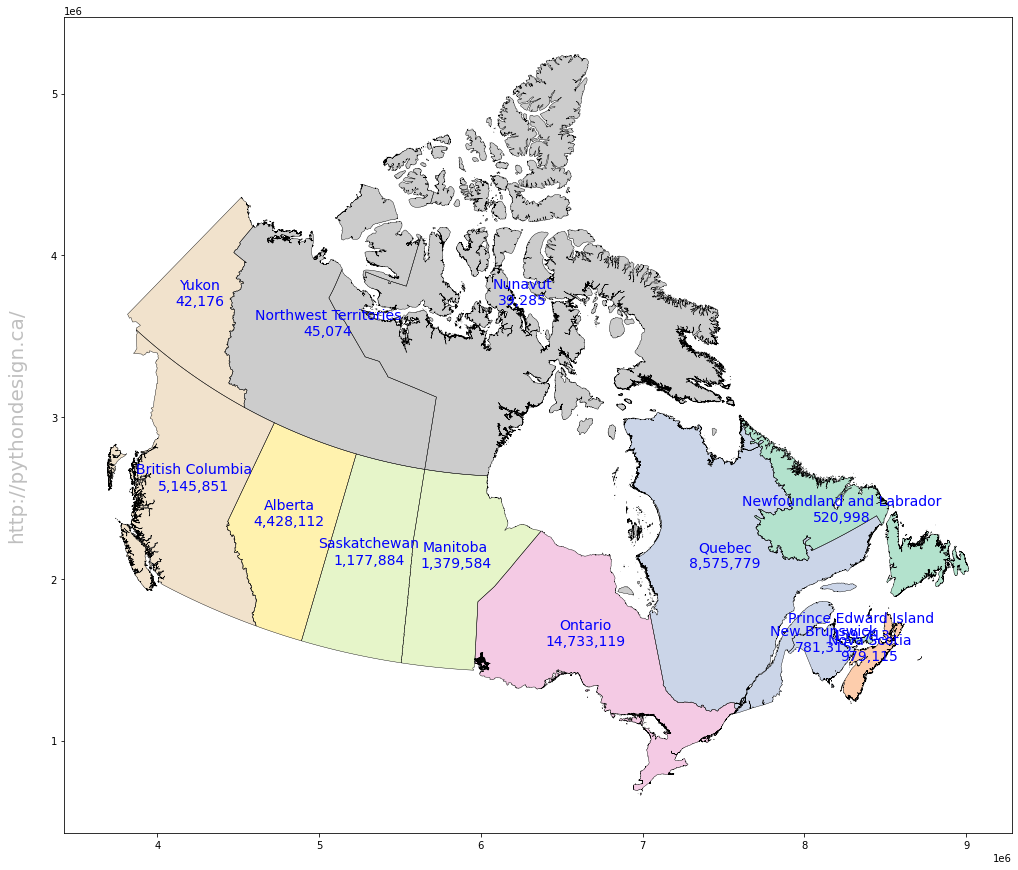
# add province name and populations on map
fig = plt.figure(1, figsize=(25,15))
ax = fig.add_subplot()
merged.apply(lambda x: ax.annotate(text=x.PRENAME + "\n" + str(x.population), xy=x.geometry.centroid.coords[0], ha='center', fontsize=14, color='blue'), axis=1);
merged.boundary.plot(ax=ax, color='Black', linewidth=.4)
merged.plot(ax=ax, cmap='Pastel2', figsize=(12, 12))
ax.text(-0.05, 0.5, 'http://pythondesign.ca/', transform=ax.transAxes,
fontsize=20, color='gray', alpha=0.5,
ha='center', va='center', rotation='90')
Step 4: Execute the code to generate the map
Inspired by:
1. https://health-infobase.canada.ca/covid-19/dashboard/
2. https://jcutrer.com/python/learn-geopandas-plotting-usmaps
need fix the overlapping annotations later.